
By Keith Lawrence Miller, M.A., Founder – Ivy League Résumés
Most executives have exceptional accomplishments — but fail to quantify them.
In a competitive 2025 market where executive search firms scan hundreds of profiles daily, numbers are no longer optional. They are the difference between getting an interview and getting ignored.
Recruiters, CHROs, and CEOs need measurable proof of impact. They want to see magnitude, trajectory, and business value. When your accomplishments are quantified correctly, your resume becomes a financial artifact — not a career summary.
Below, I’ll break down how to quantify achievements strategically, using the same methodology I apply when branding global CEOs, COOs, CFOs, and enterprise-level executives.
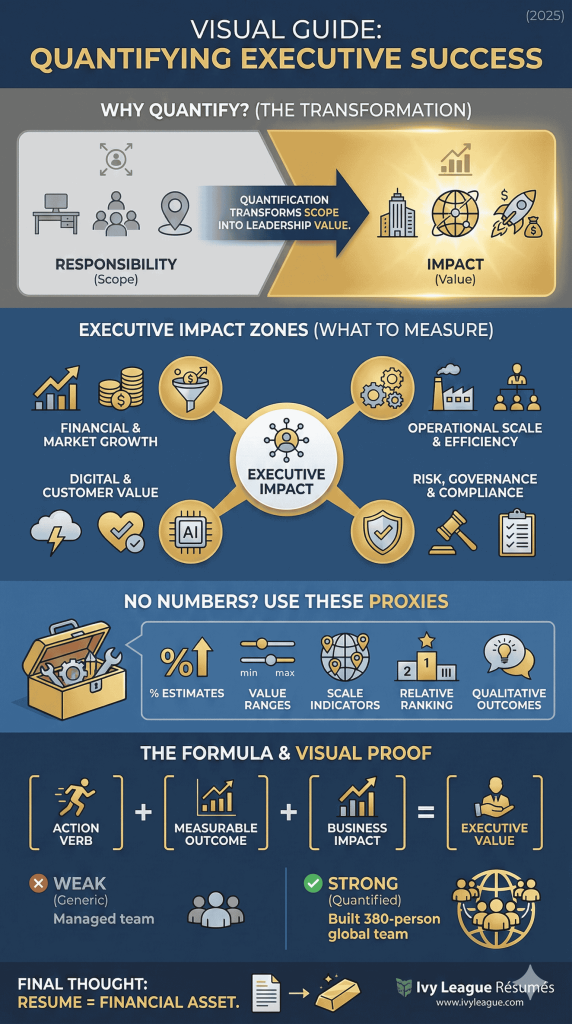
Why Quantification Is the Secret Weapon of Executive Resumes
Numbers instantly answer two critical questions:
1. How big was your responsibility?
P&L size, team size, budgets, markets, geographies.
2. How big was your impact?
Revenue generated, costs reduced, efficiencies gained, growth achieved.
Executives are judged not by what they did — but by how the business changed because of them.
When you quantify achievements, you are communicating:
-
Scale
-
Authority
-
Leadership maturity
-
Commercial intelligence
-
Organizational influence
-
Executive altitude
Most candidates skip this.
Those who don’t instantly rise to the top.
What You Should Quantify (Executive-Level Categories)
Executives should quantify achievements in all areas:
1. Revenue & Growth Metrics
-
Revenue increase (absolute or %)
-
ARR growth
-
Market share gained
-
New business expansion
-
Customer acquisition metrics
Executive accomplishment example:
-
Grew revenue 62% in 24 months, expanding into three new markets and launching two new product lines.
2. Profitability & Margin Impact
-
EBITDA improvements
-
Gross margin expansion
-
Cost-to-serve reduction
-
Cash flow increases
Example:
-
Improved EBITDA margins by 19% by redesigning cost structures and renegotiating vendor contracts.
3. Cost Optimization & Efficiency
-
Operating cost reductions
-
Workforce productivity improvements
-
Automation benefits
-
Cycle-time reductions
Example:
-
Reduced operating costs by $14M annually through process re-engineering and automation.
4. Team & Organizational Scale
-
Size of teams managed
-
Number of direct/indirect reports
-
Geographic reach (regions, markets, global span)
-
Cross-functional leadership data
Example:
-
Led a 5,200-employee global workforce across operations, technology, sales, and shared services.
5. P&L Ownership
-
P&L value (e.g., $200M, $1.4B)
-
Budget responsibility
-
Capital allocation oversight
Example:
-
Oversaw $900M P&L, driving organizational restructuring and productivity improvements.
6. Operational Impact
-
Efficiency gains
-
Throughput increases
-
Cycle-time reductions
-
Productivity metrics
Example:
-
Increased operational throughput by 47% by implementing Lean methodologies across three divisions.
7. Sales & Commercial Metrics
-
Pipeline expansion
-
Win rates
-
Average deal size
-
GTM improvements
-
Sales cycle compression
Example:
-
Expanded pipeline 3.4× and increased win rates by 22% through GTM realignment.
8. Customer Impact
-
NPS improvements
-
Retention increases
-
Churn reduction
-
Customer lifetime value (LTV)
-
CSAT scores
Example:
-
Boosted NPS from 38 → 62 by redesigning customer experience workflows.
9. Digital Transformation Metrics
-
System adoption rates
-
Automation ROI
-
Time saved
-
Cost saved from modernization
Example:
-
Automated 72% of manual processes, saving 9,800+ labor hours annually.
10. Risk, Governance, and Compliance
-
Audit accuracy
-
Reduction in compliance findings
-
Strengthening governance frameworks
Example:
-
Improved audit compliance from 78% → 99% within two cycles.
How to Quantify Accomplishments When You Don’t Have Numbers
Executives frequently say:
“I know I delivered value — but I don’t have the data.”
You almost always have quantifiable impact. You simply need to extract it.
Use these conversion strategies:
1. Convert Outcomes Into Percentages
If you don’t know the absolute number, estimate the percentage.
Example:
-
“Accelerated onboarding process by 40%.”
2. Use Ranges Instead of Exact Data
Example:
-
“Oversaw multi-million-dollar project portfolio ($40–60M).”
3. Highlight Team or Organizational Scale
Even without financial data:
-
Headcount
-
Regions
-
Divisions
-
Customers
-
Product lines
Example:
-
“Led global operations across 14 countries and 6 business units.”
4. Use Relative Comparisons
Example:
-
“Ranked #1 region for YOY performance out of 12 national segments.”
5. Tie Impact to Qualitative Outcomes
Example:
-
“Accelerated time-to-decision for executive leadership by consolidating reporting systems.”
This still reflects strategic value.
The Executive Resume Formula for High-Impact Quantification
Every C-suite bullet should follow this structure:
Action verb + measurable outcome + business impact
Example:
Accelerated revenue growth by 38%, entering two new markets and shifting GTM strategy to prioritize enterprise clients.
Or:
Reduced $22M in operational waste, improving EBITDA and increasing productivity across 3 divisions.
If your bullets follow this pattern, your résumé becomes magnetic.
Weak vs. Strong Executive Accomplishment Examples
Weak (No numbers):
-
“Led operations for the company’s largest division.”
Strong (Quantified):
-
Directed operations for a $600M division with 1,400 employees across 8 U.S. regions.
Weak:
-
“Improved customer experience.”
Strong:
-
Increased NPS by 24 points, achieving highest customer satisfaction score in company history.
Weak:
-
“Reduced operating costs.”
Strong:
-
Cut operating costs by $12.4M through automation and process redesign.
Weak:
-
“Managed a team.”
Strong:
-
Built and led a 380-person team across operations, quality, and customer experience.
How Quantification Levels Up Your Executive Brand
Quantification does more than make bullets stronger.
It fundamentally changes how you are perceived:
-
Clear thinker
-
Effective communicator
-
Commercially intelligent
-
Results-oriented
-
Executive-mature
-
Board-ready
Executives who quantify their work outpace those who don’t.
Final Thoughts: Numbers Are Your Executive Advantage
Your résumé is not just a career document — it is a financial and strategic communication asset.
When you quantify achievements:
-
Recruiters take you seriously
-
CHROs see your leadership value
-
CEOs understand your impact
-
Boards recognize your decision-making maturity
Quantification is the language of enterprise leadership.
If you want a résumé that speaks this language with clarity, precision, and authority, Ivy League Résumés can build it with you.
Ready to transform your executive résumé into a quantified, board-caliber asset? Ivy League Résumés specializes in doing exactly that.